Background
Fraud Rules Service (FRS) is a rule engine in Goto Financial’s sanctions platform (my team). FRS lets you write dynamic rules to fight against fraud.
FRS operates on a large scale. It is integrated into several points such as payments, login, and KYC, with the list going on. It is handling about 180k requests per minute including ingestion + fraud evaluation with 100ms as response time.
This article will discuss a curious case of a memory leak that occurred in FRS and how we fixed it.
Read more about FRS here: link
Preface
Approximately two months ago, we started seeing issues with the service where the pod’s current memory would keep increasing and exceed the requests set up on Kubernetes.
We assumed it might be because the required memory was higher, so we increased the requests, but it still exceeded the allocated requests threshold.
At this point, we were not seeing any issues. There were occasional increases in response time when the memory would come close to the limit threshold. Since the development was going in full swing, there were several deployments back to back which would cause the pods to restart and never hit the limit.
Once we moved to other tasks, we started seeing the pods go OOMKilled. We took turns looking into the issue, but we couldn’t determine the exact cause. The usual fix for this was to restart the pods and leave it at that.
We had tried several things to get the memory back to previous state. The response time was increasing and hence we had to scale it up. The scale up helped with the response time and gave us some breathing room until we fixed the issue.
I’ll be skipping the things that were attempted as I want to focus on the problem caused by a Clojure core(std) library function.
The Problem
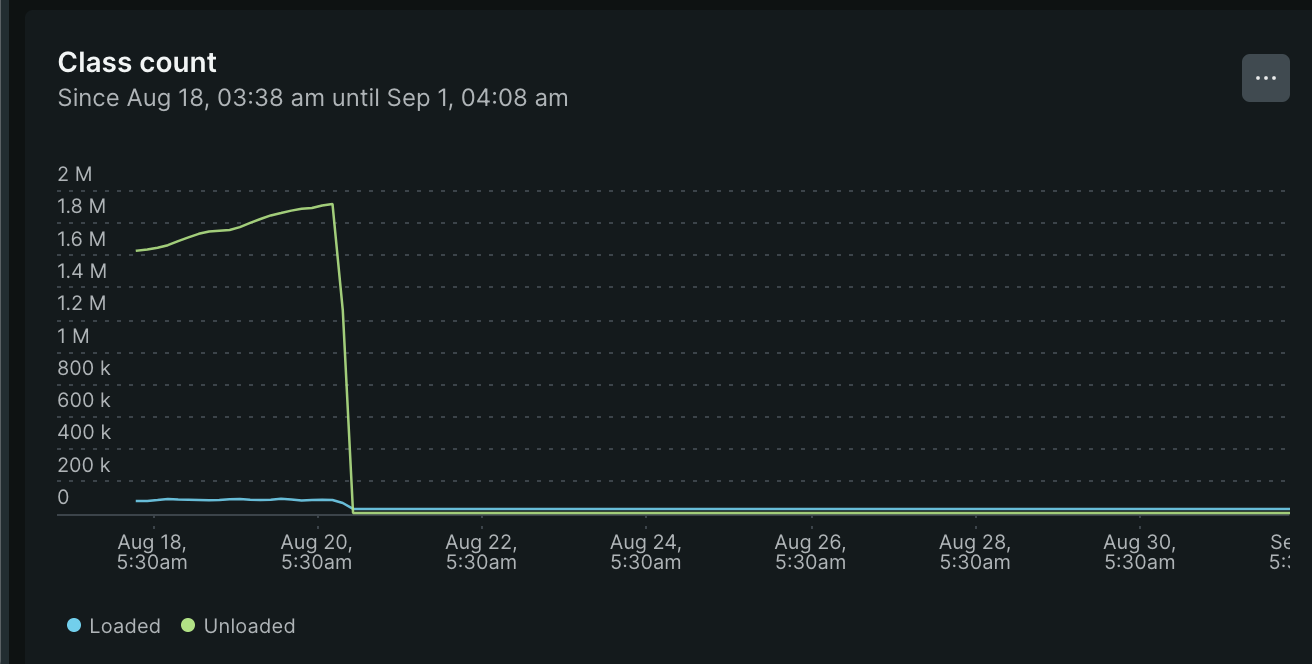
After going through millions of graphs (not literally), we saw that New Relic has JVM instrumentation through APIs exposed on JMX. One of the graphs particularly stood out. We had looked at it earlier, but we ignored it, thinking it was a common JVM behaviour.
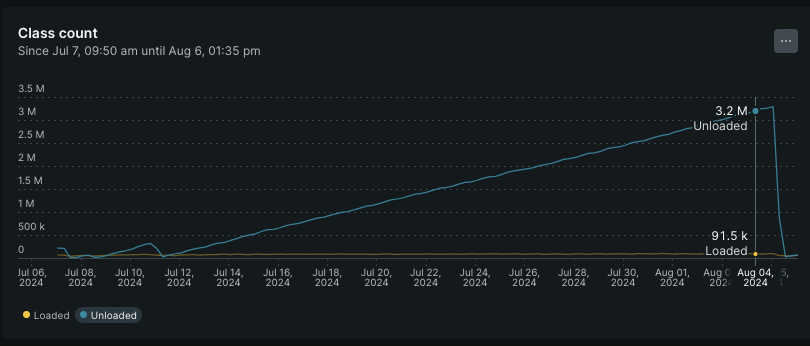
The classes unloaded count keeps increasing after each deployment. It would never stop. The loaded classes was also inconsistent.
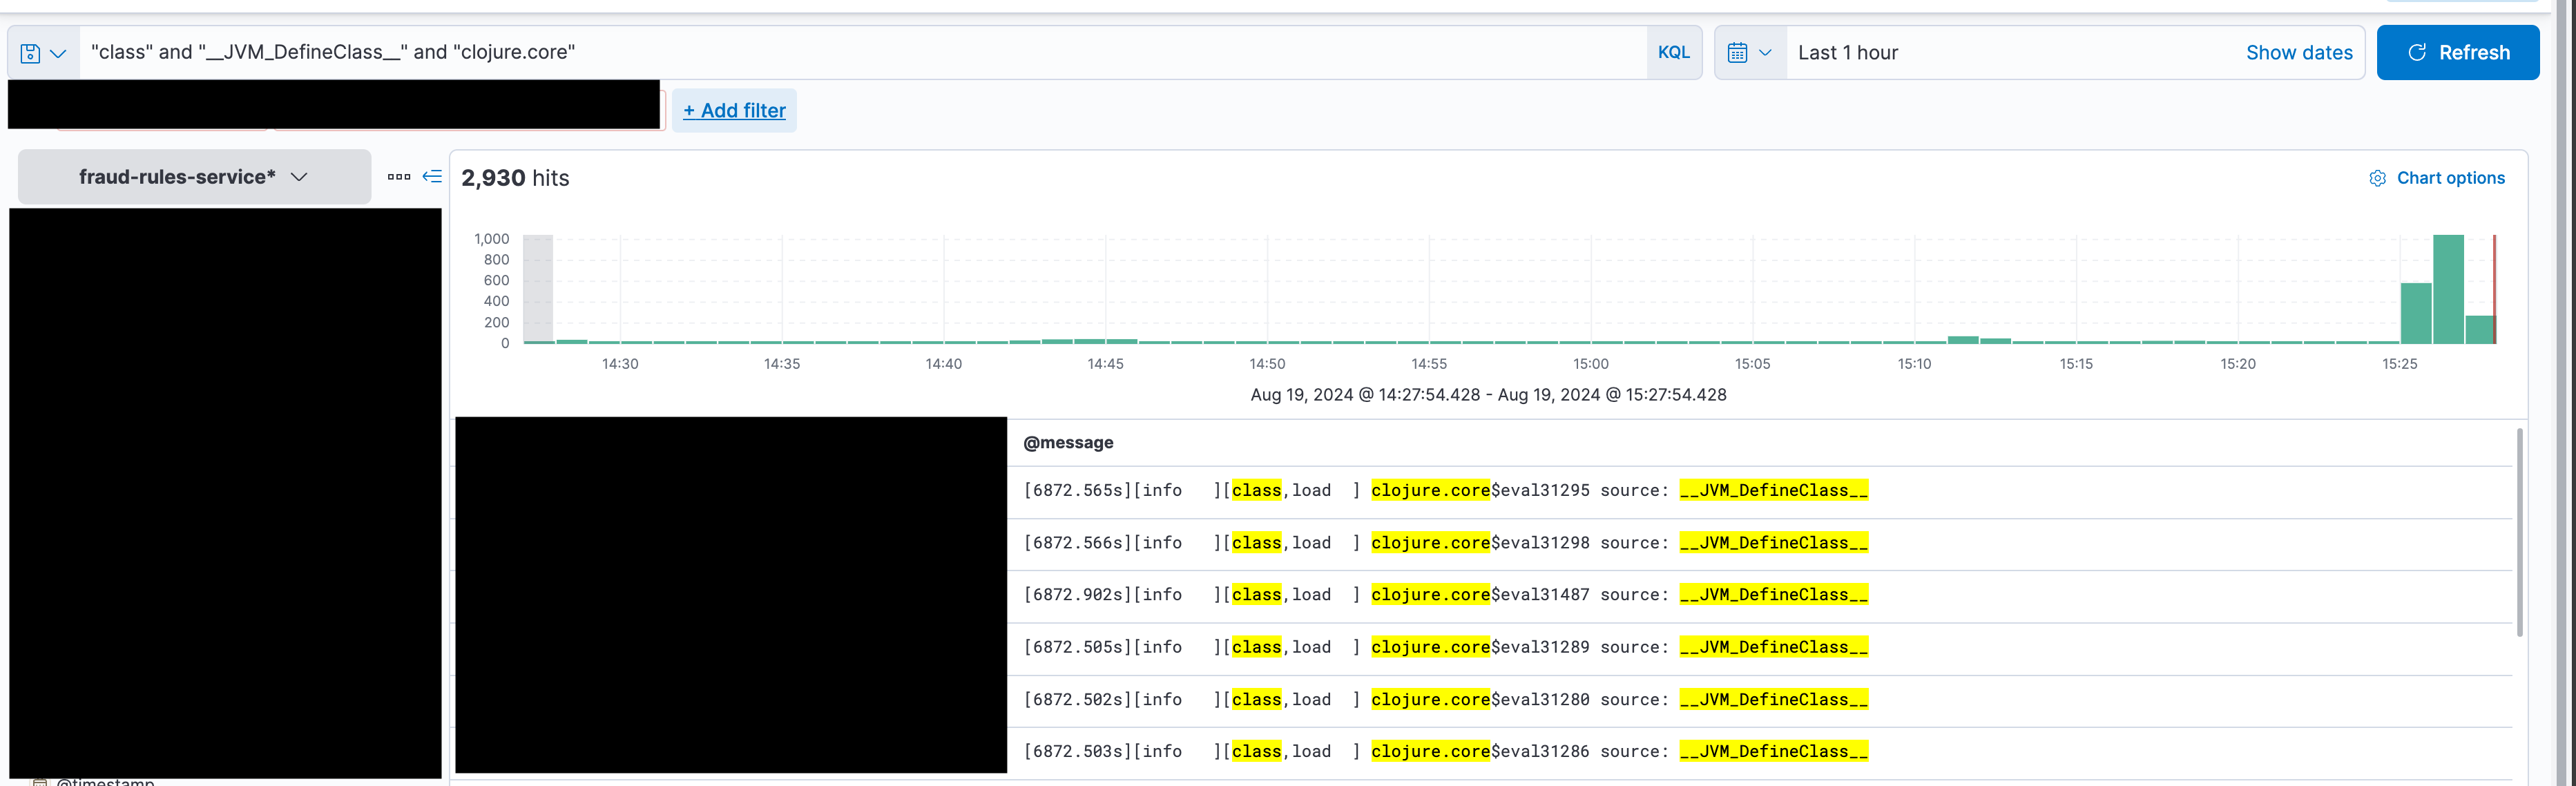
Tried to find ways to see the classes being loaded. Turns out we can turn on class loader tracing with couple of JVM params. Using the following:
-XX:+TraceClassLoading
-XX:+TraceClassUnloading
Added these params to the staging server and started hitting the server with high number of requests. Started to see lot of logs of classes being loaded and most of them were loaded by clojure.core/eval.
Simple google search brought up this stackoverflow link. There seems to be instances of this behaviour noticed earlier and it is the default behaviour of clojure.core/eval.
The Actual Issue
The eval function makes a call to a Java method in the Compiler.java class. As you can see:
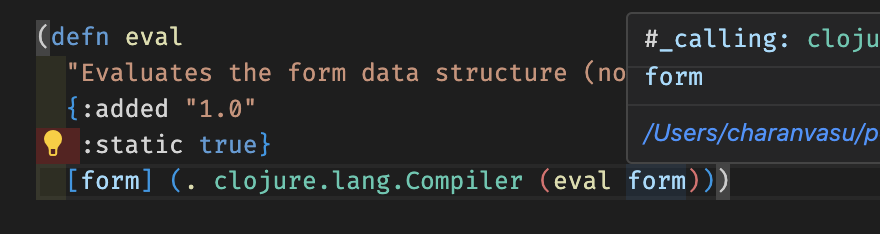
If we dig into this method, we’ll see the following code, which initializes a classloader on each call.
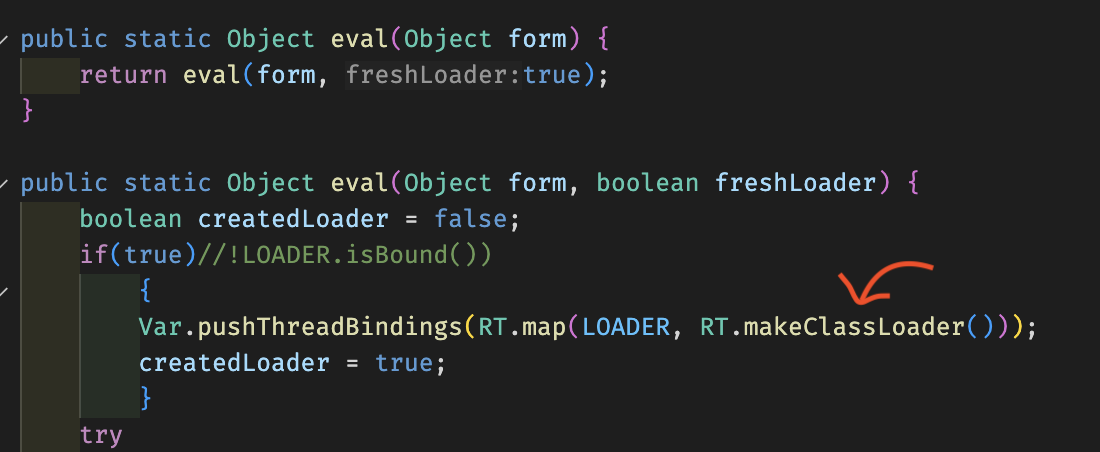
This causes the memory overhead. This will also not be cleaned up until the classes loaded by the loader is dereferenced.
There were several reported cases of eval causing memory issues, functionality issues and performance in some cases.
- Clojure: memory leaks using eval
- Clojure creates lots of classloaders
- Reduce number of calls to eval by the compiler
- Clojurian slack
The reason eval loads a new classloader every time is justified as dynamically generated classes cannot be garbage collected as long as the classloader is referencing to them. In this case, single classloader evaluating all the forms and generating new classes can lead to the generated class not being garbage collected.
To avoid this, a new classloader is being created every time, this way once the evaluation is done. The classloader will no longer be reachable and all it’s dynamically loaded class.
Final Notes
As a result, we removed the usage of eval and did a quick load test on the staging. We were able to see that the classes loaded were stabilised. After compiling all the results, we concluded to take the changes to production.
After a week of the deployment, the following graph shows the same:
This also reduced the GC CPU time:
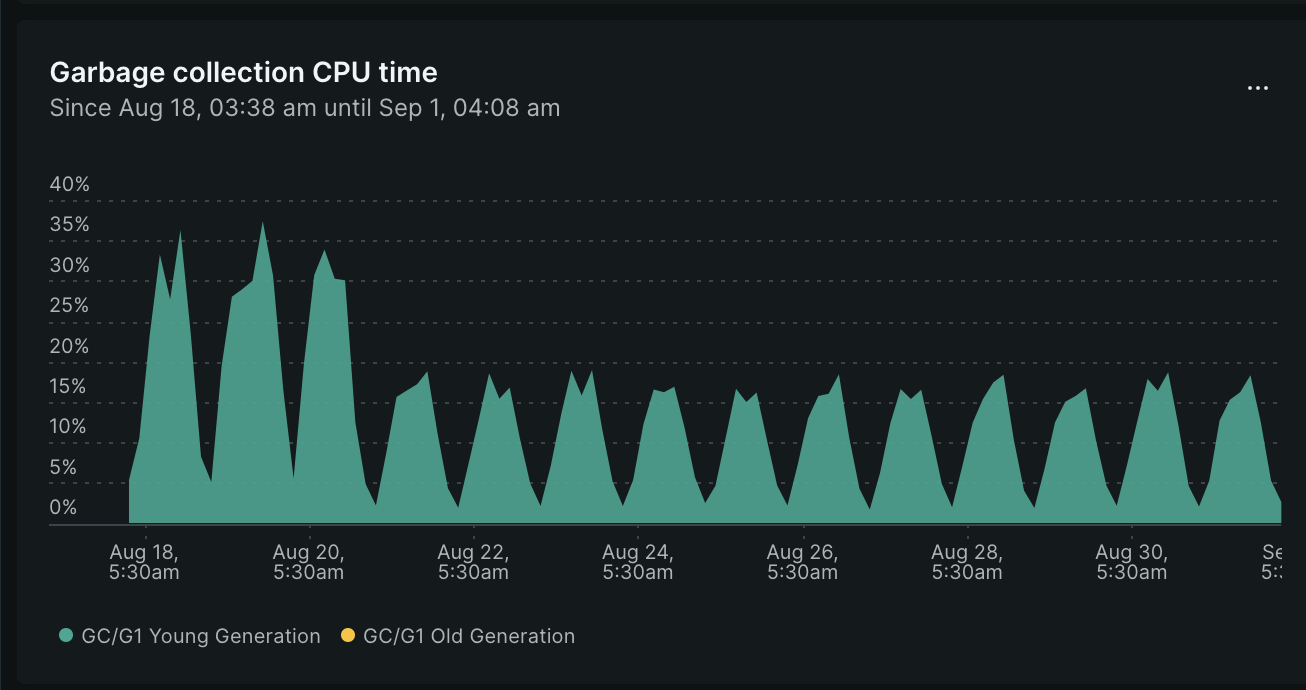
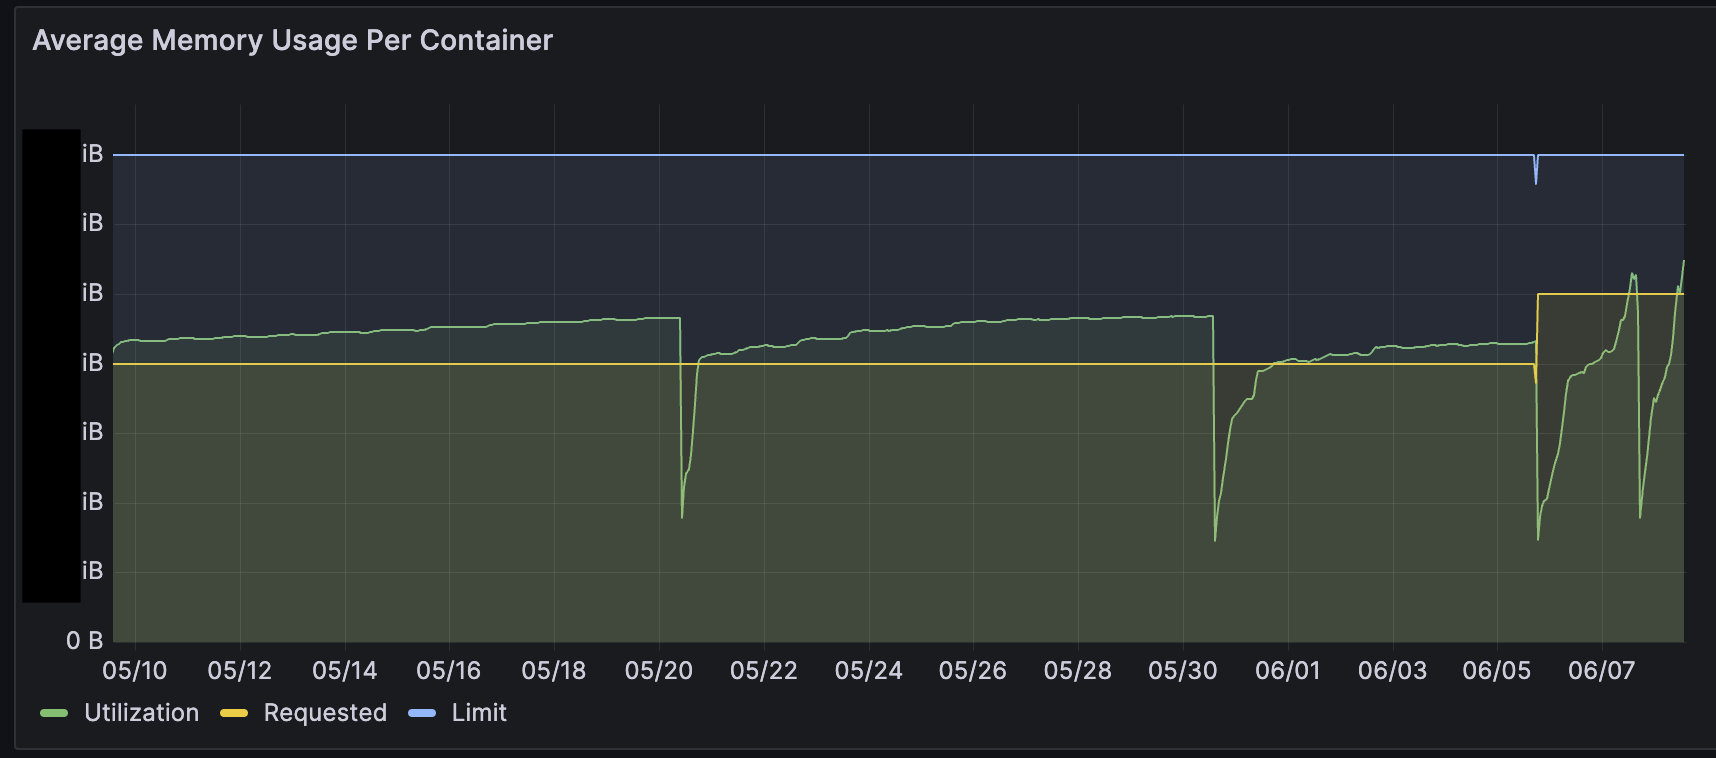
And drum roll, the memory usage dropped by a lot and we started planning to reduce the resources for the service.
There was also an additional reduction in response time, which I assume was due to the decrease in GC time.
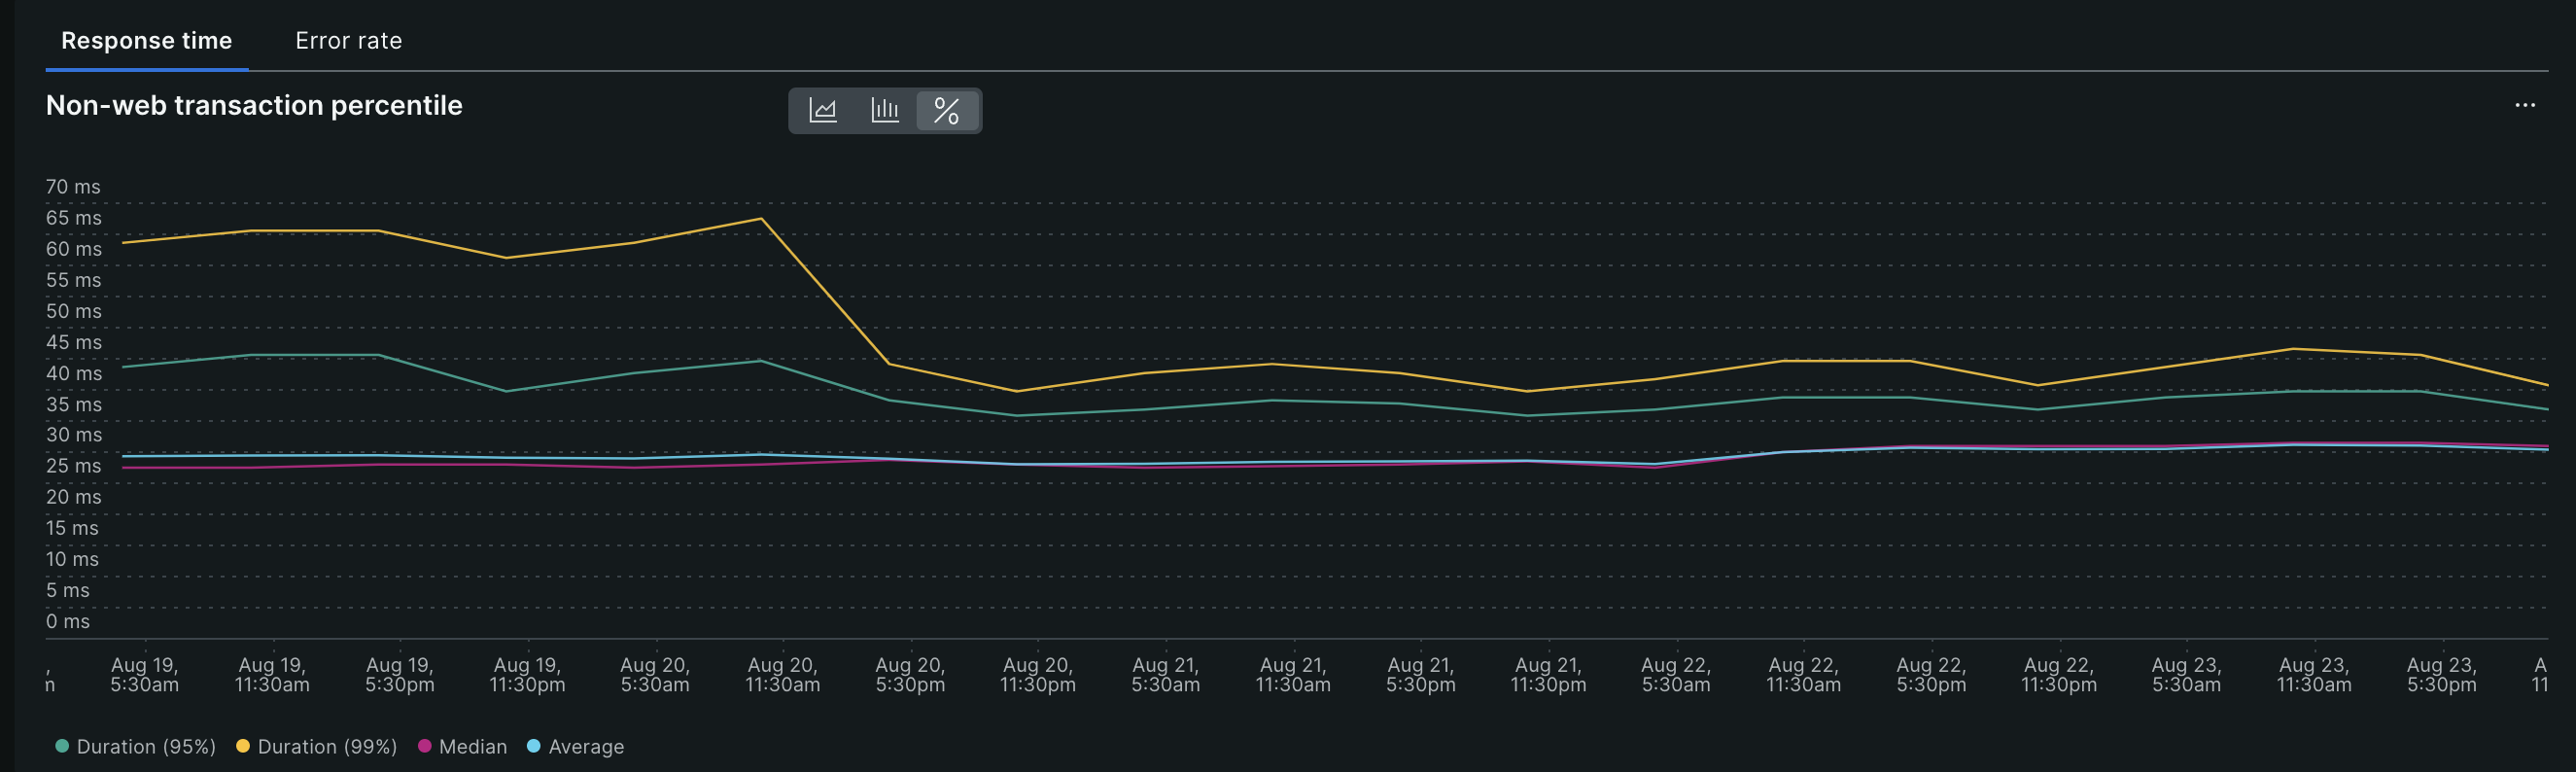
This has impacted the error rate and it went near zero. Our overall SLA has improved.
Further: I still want to dig on why the classloader is not being GC’d. Will make a separate article if I manage to find out.